Help Center
Not seeing any data in the Attributer interface
Once you’ve added the Attributer code to your website (and maybe even added the hidden fields to your forms), you may be expecting the ‘Getting Started’ screen to go away and to start seeing some data in the Attributer interface at app.attributer.io. You may also be expecting to be able to build some charts and dashboards.
That isn’t how Attributer works, though.
In this help article, we’ll explain how Attributer works and how to ultimately get to the point you are trying to get to (which is, assumedly, being able to build some charts and dashboards).
How Attributer works
When a visitor lands on your site, Attributer looks at a bunch of technical information about how that visitor got there (same things as tools like Google Analytics look at) and uses it to determine where the visitor originated from.
Attributer then categorizes the visitor into a standardized set of marketing channels (the same channels you see in tools like Google Analytics, such as Organic Search, Paid Social, Paid Search, etc) and saves the data to a cookie in the user’s browser.
Then, when a visitor submits a form on your website, Attributer writes the attribution information into the hidden fields, which your form builder captures.
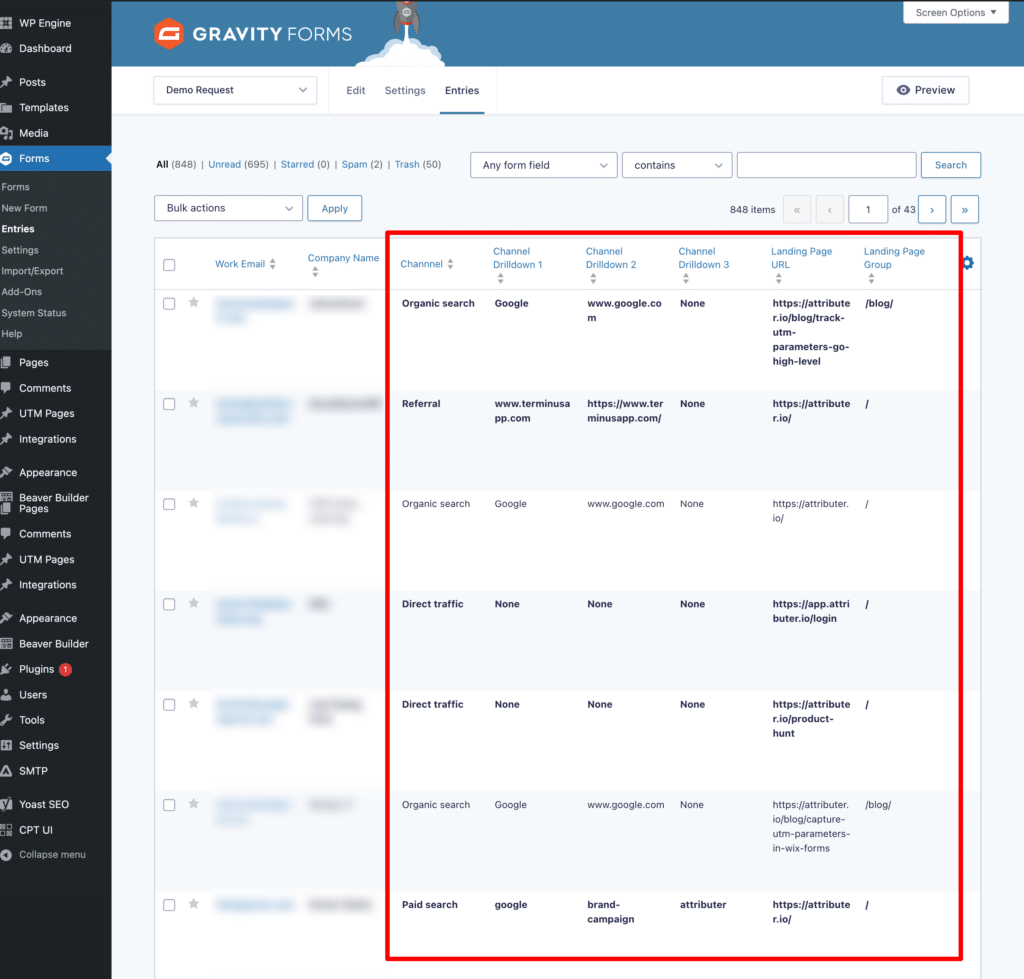
The idea is that you can then use your form builder’s built-in integrations (or a third-party integration tool like Zapier) to send the data on to your other tools. This could be your CRM (Salesforce, Hubspot, Pipedrive, etc) or it could be to a spreadsheet (like Google Sheets).
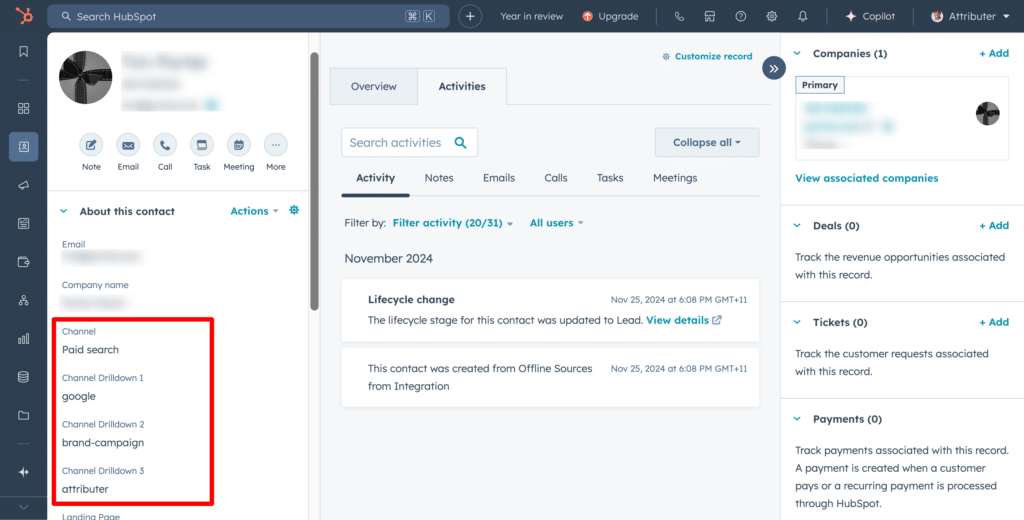
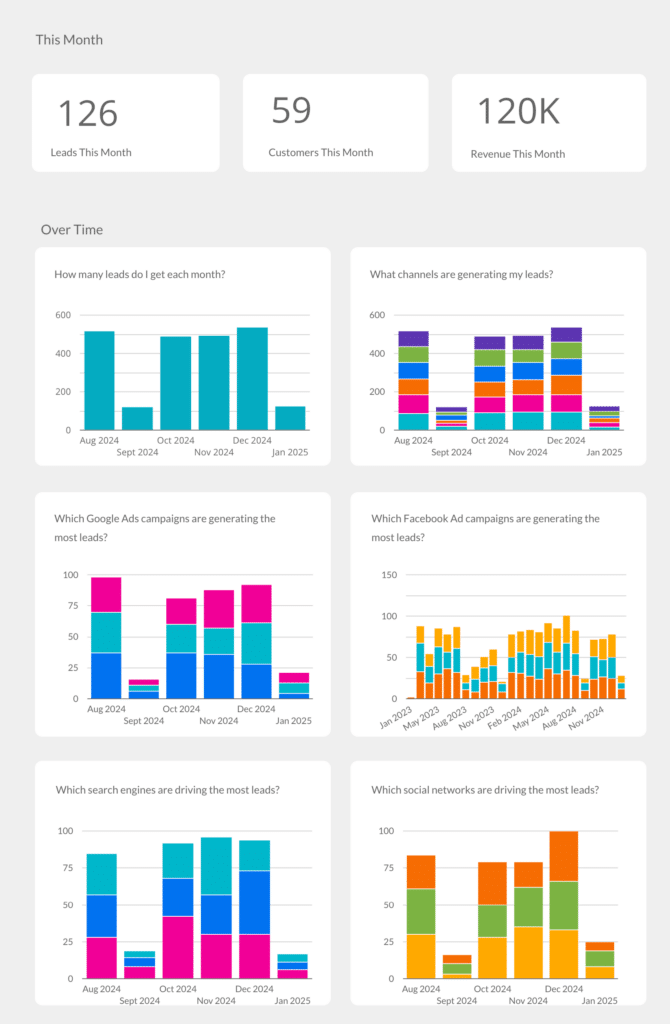
Finally, once you have this data in your CRM or in a spreadsheet, you can use the CRM’s built-in reporting tools (or a third-party reporting tool like Google Data Studio) to build charts and dashboards that show how your various marketing initiatives are performing.
Why doesn’t Attributer allow me to build charts and dashboards in the interface?
There are a few reasons why we decided not to develop features to build charts and dashboards within Attributer. These include:
- Plenty of great, existing tools – Most CRM’s have built-in reporting tools that are great (HubSpot, Salesforce, Zoho, Pipedrive, etc. all have good reporting capabilities). On top of that, there are countless charting & dashboarding tools out there (many of which are free). Our product philosophy is that the world does not need another charting & dashboarding tool, it just needs a way to get marketing attribution data into those tools so you can use it build charts & dashboards that show where your leads and customers are coming from.
- The rest of the data lives in other tools – If you want to run reports on how many new customers you’ve generated from your ads, or how much revenue was generated, then that data lives in other tools. In most cases, this is your CRM (because when a lead converts to a customer, you typically mark the deal/opportunity as closed and assign a revenue amount). Our belief is that it’s better to send the attribution data into those tools so you can see where a particular customer came from, rather than trying to extract that data out of the tool and make it available in some sort of Attributer reporting interface.
Can't find the answer you need? Contact us!
Our team are available to answer any questions you have